Introduction
In the modern digital ecosystem, the linear path from awareness to purchase is a relic of the past. Today’s customer journey is a complex, non-linear matrix of interactions spanning multiple devices, channels, and intent signals.
Streamline your software evaluation process
For Customer Support Leads and Operations Directors, the challenge is no longer just about resolving tickets; it is about omnichannel orchestration—ensuring that every interaction is seamless, contextual, and additive to the customer's lifetime value (LTV).
As a comprehensive customer support journey guide, this article moves beyond theoretical mapping to operational reality. Recent data indicates that 73% of customers say customer experience influences their buying decisions, yet many organizations still suffer from the "Data Silo" problem.
Support teams often possess one view of the customer while sales and marketing hold entirely different pieces of the puzzle. This fragmentation leads to disjointed experiences, high customer effort scores (CES), and ultimately, churn.
Effective customer journey mapping is not merely a visualization exercise; it is a critical operational audit. It requires shifting from a reactive posture—dealing with symptom tickets—to a proactive strategy that identifies root cause friction before it escalates into an SLA breach.
By distinguishing between Front-Stage touchpoints (what the customer sees) and Back-Stage processes (internal workflows), support leaders can pinpoint exactly where breakdowns occur.
This guide provides a technical, step-by-step framework for mapping your customer journey. We will explore how to leverage sophisticated data from tools like Zendesk, Freshdesk by Freshworks, and respond.io to automate the identification of pain points, solve integration challenges, and secure executive buy-in for necessary optimizations.
Leading CRM Solutions to Know
While this guide explores key industry insights, seeing these principles in action requires the right platform. Here is a snapshot of the most recognized Customer Support solutions currently shaping the market:


Phase 1: Preparation and Persona Development
Before plotting a single touchpoint, you must define the who. However, for support and operations professionals, standard marketing personas—often based on demographics—are insufficient. You need behavioral personas that reflect technical proficiency, channel preference, and patience thresholds.
Defining Behavioral Archetypes
Start by segmenting your audience based on their interaction with your support ecosystem. A generic "Manager Mary" persona is less useful than distinguishing between:
The No-Code User: This user relies heavily on UI-based configurations and requires high-touch, step-by-step guidance. Their friction points usually center on terminology and navigation.
The Developer/Admin: This user interacts primarily with your API and documentation. Their patience for "Tier 1" scripted responses is near zero. If they contact support, it is likely a complex edge case or a platform bug.
Understanding these distinctions allows you to map specific Breakdown Paths—the trajectory a customer takes when things go wrong—rather than just the idealized "Happy Path."
Internal Empathy Interviews
To build a map that reflects reality, you must conduct Internal Empathy Interviews with your front-line agents. These agents are often the first to notice "Silent Churn" indicators—frustrations that cause customers to leave without ever opening a formal ticket.
Key questions to ask your support team include:
Where do customers express the most confusion during onboarding?
Which workaround processes are you manually performing to compensate for product gaps?
What is the most common "feature request" that is actually a usability complaint?
Gathering this qualitative data helps you categorize future findings into Technical, Emotional, and Process pain points, ensuring that your map addresses the Employee Experience (EX) as well. A journey that is seamless for the customer but creates a manual nightmare for agents is not sustainable.
Phase 2: Auditing the Ecosystem to Identify Touchpoints
A touchpoint is any interaction that alters the customer's perception of your brand. With customers now using 3 to 6 touchpoints per purchase, the complexity of auditing these interactions has increased exponentially. You must inventory every digital, physical, and human-assisted interaction.
Digital vs. Human-Assisted Touchpoints
Your audit should separate automated interactions from human ones to identify Omnichannel Friction. This friction often occurs during the "handoff." For example, if a customer initiates a query via an AI-driven chatbot but has to repeat their issue when transferred to a live agent, that is a critical failure point.
Key areas to audit include:
Pre-Sales: Social media comments, demo requests, live chat inquiries.
Onboarding: Welcome emails, in-app tooltips, API documentation access.
Support: IVR menus, Help Center searches, ticket submission forms, status update notifications.
Renewal: Billing notifications, account review calls, automated invoices.
The "Silent" and "Shadow" Touchpoints
Do not overlook passive or external touchpoints. A billing receipt that lands in a spam folder is a touchpoint. A 404 error page on your knowledge base is a touchpoint. These "micro-interactions" often contribute significantly to a degraded Net Promoter Score (NPS) but are rarely captured in high-level marketing maps.
Furthermore, you must audit Shadow Support channels. These are places where customers seek help outside your official ecosystem, such as Reddit, Stack Overflow, or industry-specific Slack communities. If your users are forced to rely on strangers for accurate configuration advice because your official documentation is outdated, that is a major friction point that needs to be mapped and addressed.
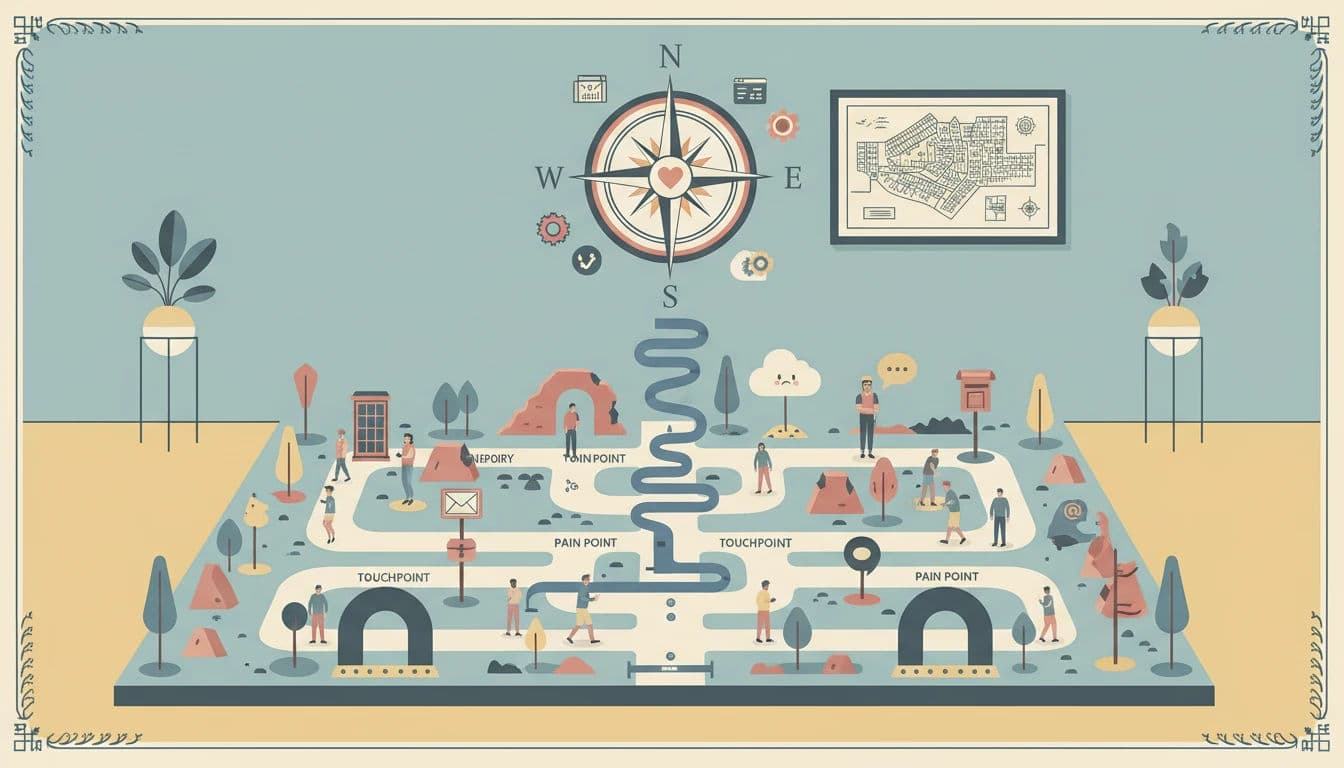
Phase 3: Plotting the Journey Stages
Once you have your inventory, you must plot these touchpoints across the standard lifecycle stages: Awareness, Consideration, Decision, Retention, and Advocacy. For this guide, we will focus heavily on the Retention and Advocacy stages, as these are the domains where support software plays the most pivotal role.
Mapping the Post-Purchase Landscape
Marketing maps often end at the "Decision" (purchase) phase, but for SaaS and subscription models, the real journey begins post-purchase.
Adoption: This is the "Time to Value" phase. If the user cannot configure the software within the first week, churn risk increases. Map the specific support articles and automated emails triggered during this window.
Resolution: This occurs when the user encounters a problem. Map the steps: User encounters error -> Searches Google -> Finds Help Center -> Submits Ticket -> Receives auto-reply -> Agent investigates -> Resolution.
Expansion: The point where a satisfied customer upgrades their tier. This is often triggered by successful support interactions that demonstrate the value of premium features.
Identifying Circular Journeys
A critical aspect of mapping is identifying Circular Journeys. These are loops where a customer is bounced between stages without resolution. A common example is the "Tier 1 Loop," where a customer explains a complex technical issue, receives a generic macro response, replies with frustration, and is treated as a new interaction by a different agent who sends the same macro.
Mapping these loops helps you implement "circuit breakers" in your support logic, such as auto-escalation after two customer replies.
Visualizing Front-Stage vs. Back-Stage
Use a "Service Blueprint" approach. For every customer action (Front-Stage), map the corresponding internal process (Back-Stage).
Customer Action: Submits a refund request.
Front-Stage Touchpoint: Chatbot confirms receipt.
Back-Stage Process: Ticket is routed to the Finance queue via round-robin assignment; agent verifies SLA eligibility; finance approves; credit is issued.
Visualizing the Back-Stage allows you to see where internal bottlenecks (e.g., manual approval by Finance) are causing delays that the customer perceives as poor service.
Find Perfect Software For Your Business
Phase 4: Customer Pain Points Analysis
With the map visualized, you can now layer on the data to diagnose pain points. This is where you move from qualitative assumptions to quantitative validation. You are looking for high-friction zones where the customer's momentum is halted.
Categorizing Friction
To prioritize fixes effectively, categorize pain points into three buckets:
Technical Pain Points: Broken links, slow page load times, API failures, or buggy UI elements. These are objective failures.
Process Pain Points: Redundant form fields, requiring customers to call for cancellations, or strict policies that empower agents to say "no" rather than solve problems.
Emotional Pain Points: Tone-deaf automated responses, long hold times, or a lack of empathy in agent scripts.
The Prioritization Matrix
Not all pain points are created equal. Use a Prioritization Matrix to weigh Impact on Churn against Ease of Resolution.
High Impact / Low Effort: These are your "Quick Wins." Example: Updating a confusing FAQ article that generates 10% of your ticket volume.
High Impact / High Effort: These are strategic projects. Example: Re-engineering the entire billing portal to support self-service upgrades.
Low Impact / Low Effort: Fillers to address when bandwidth allows.
Low Impact / High Effort: Ignore these. They are resource traps.
The Peak-End Rule
Research on the Peak-End Rule suggests that customers judge an experience largely based on how they felt at its peak (the most intense point) and at its end. If the "peak" of a support interaction is high anxiety (e.g., a server outage) and the "end" is a generic, unresolved ticket closure, the entire journey is tainted.
Identify the emotional peaks in your map. Are they positive (the moment a solution works) or negative (the moment they realize data is lost)? Your goal is to engineer the journey so that the "End" is always a high-satisfaction resolution, even if the "Peak" was a moment of frustration.
The API Glue: Solving the Data Integration Challenge
One of the most significant barriers to effective journey mapping is the technical fragmentation of data. Your CRM knows the customer's value, your Support Desk knows their complaints, and your Product Analytics tool knows their usage behavior. Without connecting these, your map is incomplete.
Solving this requires an "API Glue" strategy. Modern support operations must leverage middleware or native integrations to create a Single Customer View. For instance, if a high-value customer (identified in Salesforce) hits a 404 error (identified in Datadog) and then opens a chat (in Intercom), the agent should see all three events immediately.
Tools that support robust API webhooks and pre-built connectors are essential here. When evaluating software, prioritize those that offer "Zero-Copy" integration or seamless bi-directional syncing, as this reduces the technical debt associated with maintaining custom data pipelines.
Leveraging Software to Optimize the Journey
Manual mapping on whiteboards is a good starting point, but to operationalize your findings, you need software that provides real-time data and omnichannel visibility. Tools like Zendesk, Freshdesk by Freshworks, and respond.io offer distinct capabilities for identifying and resolving journey friction.
1. Optimizing the Zendesk Customer Journey
Zendesk excels at turning unstructured support data into actionable journey insights. By utilizing Zendesk Explore, you can analyze ticket tags to identify recurring friction points. For instance, if you notice a spike in tickets tagged onboarding_error at the 3-day mark of the customer lifecycle, you have identified a specific breakdown path.
Furthermore, Zendesk’s Sunshine platform allows you to connect data from external sources (like your product backend) directly into the agent workspace. This solves the data silo issue, giving agents a holistic view of the customer’s journey—such as their recent cart activity or error logs—before they even say hello. This context allows for proactive support, reducing the need for customers to explain their journey history.
2. Automating Workflows with Freshdesk by Freshworks
Freshdesk provides robust features for mapping and automating the "Back-Stage" processes that often cause delays. Its Customer Timeline feature offers a chronological view of every interaction a customer has had with your brand across email, phone, and chat. This visual timeline is essentially a real-time journey map for individual users.
You can leverage Scenario Automations in Freshdesk to address process pain points. If your map reveals that customers frequently churn after waiting 48 hours for a specific technical fix, you can create an automation that escalates tickets to a Tier 2 engineer if they remain unresolved for 24 hours. This ensures that the "Process" pain point is neutralized by intelligent workflow routing.
3. Enhancing Conversational CX with respond.io
For businesses heavily reliant on instant messaging, respond.io is critical for mapping the conversational journey. In markets where WhatsApp or Messenger are primary channels, the journey is often fragmented by the 24-hour messaging windows imposed by these platforms.
Respond.io unifies these disparate messaging channels into a single inbox, ensuring Contact Merge capabilities. This prevents the common issue where a customer is treated as a new lead on WhatsApp despite having a long history on Facebook Messenger. By using respond.io’s Workflows, you can map complex chat journeys that qualify leads or route support queries automatically, ensuring that the conversational touchpoints are as structured and measurable as traditional ticketing.
Securing Executive Buy-In for Journey Optimization
Identifying pain points is only half the battle; fixing them often requires budget and cross-departmental resources. To secure executive buy-in, you must translate journey friction into financial metrics.
Avoid presenting qualitative complaints like "users find the interface confusing." Instead, present data: "We receive 400 tickets per month regarding the billing UI. At a cost of $12 per ticket, this friction point costs the company $57,600 annually in support labor, plus an estimated $100k in churned revenue based on exit surveys."
Use your journey map to visualize the Cost of Inaction. Show leadership the circular journeys and the drop-off points. When you frame journey optimization as a revenue-retention strategy rather than a "customer service project," you are far more likely to get the engineering resources needed to fix the root causes.
Key Metrics to Monitor at Each Stage
To ensure your journey map remains a living document, you must assign specific KPIs to each stage. This allows you to quantify the impact of your optimization efforts. The table below outlines the critical metrics to track.
Lifecycle Stage | Primary Objective | Key Metric (KPI) | Typical Pain Point |
Awareness | Brand Visibility | Site Traffic / CTR | Confusing Value Prop |
Consideration | Engagement | Time on Site / Chat Volume | Slow Response Time |
Decision | Conversion | Conversion Rate | Checkout Friction |
Retention | Problem Resolution | CSAT / CES | High Effort Resolution |
Advocacy | Loyalty / Referral | NPS / LTV | Lack of Recognition |
Try AuthenCIO
Move to faster, smarter software evaluation with AI
Conclusion: Turning Insights into Actionable Support Strategies
Mapping the customer journey is not a "one-and-done" project; it is a discipline of continuous improvement. As Forrester predicts a shift toward Customer Journey Orchestration, the organizations that win will be those that move beyond static maps to real-time, data-driven journey management.
By auditing your ecosystem, diagnosing friction through the lens of Front-Stage and Back-Stage processes, and leveraging powerful tools like Zendesk, Freshdesk, and Respond.io, you can transform your support function from a cost center into a value driver. The ultimate goal of mapping customer experience is to lower the Customer Effort Score at every turn, ensuring that the path from user to advocate is as frictionless as possible.